
R Election Analysis Contest Results
On March 28th I announced the R Election Analysis Contest. The quantity and quality of submissions was amazing! If you have not been following along, here is a complete list of submissions, with links, in order of submission. I encourage you to read them all!
A Behind the Scenes Look…
Before announcing the winner, I’d like to tell you a bit more about how the contest came to be. I had never run a contest before, and was a bit worried that no one would submit anything. I took the risk primarily because I wanted to raise awareness of what I see as an incredibly interesting area of technology: the intersection of free analytical software (such as R) and open datasets (such as election data). People now have unprecedented access to raw data about their communities, and I am excited about the doors that it is opening.
A secondary goal was to encourage people to take the risk of publishing their own research online. I speak with a lot of R beginners who want to improve their skills. Completing interesting projects and publishing your results is one of the best ways to improve your skills.
So thank you very much to everyone who participated!
And the Winner is …
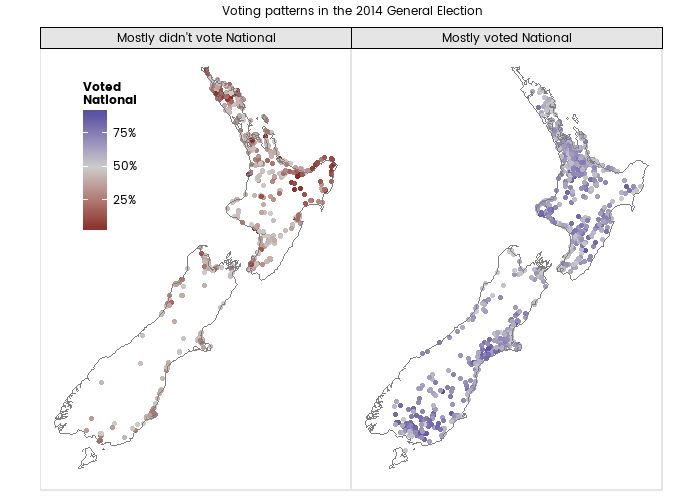
The prize goes to Peter Ellis for his work on New Zealand elections. This work includes the creation of an R package (1, 2), interactive exploration of voting locations with leaflet and Shiny (3) and an analysis of drivers of preference for the Green party over the Labour party (4). Peter is a statistician who works for the New Zealand government. His knowledge of the intricacies of New Zealand election data, desire to bring that data to a wide audience, and skill in doing so is truly amazing. Here is an image from one of his entries:
Thank you Peter, and I will be in touch with you shortly about how to claim your prize! Please join me in congratulating Peter by clicking the following tweet:
[bctt tweet=”Congratulations @ellis2013nz on winning the R Election Analysis Contest! #rstats #opendata” username=”arilamstein”]