Faster Admin 1 Maps in Choroplethr

A new version of ChoroplethrAdmin1 is now on CRAN, and it dramatically speeds up making Administrative Level 1 maps in choroplethr. “Administrative Level 1” is just a generic term for “1st subnational division”. In the US this is called a State, in Canada it’s called a Province, and so on. Overall, this package contains Admin 1 maps of 215 countries. Here is how to view the entire Admin 1 map using ggplot2:

library(choroplethrAdmin1)
library(ggplot2)
data(admin1.map)
ggplot(admin1.map, aes(long, lat, group=group)) +
  geom_polygon()

admin1-map

You can get this version of the package by typing the following from an R console:

install.packages("choroplethrAdmin1")
packageVersion("choroplethrAdmin1")
[1] ‘1.1.0’

Improvements from Version 1.0.0

As the following table shows, this version of the package is both dramatically faster and dramatically smaller than the previous version:

Commandv1.0.0v1.1.0
data("admin1.map")19.6s2.7s
admin1_map("japan")20.1s2.8s
object.size(admin1.map)545.9 Mb82.2 Mb

Fun History

This is the first update I’ve made to this package since publishing it in December 2014, and updating it brought back some pleasant memories for me. I wrote the initial version of the package while working in a cafe in Tokyo, the week before I gave a talk on choroplethr at the 2014 Japan.R conference. For old time’s sake I went to google maps and actually found the cafe:

For those of you who don’t read Japanese, the name of the cafe is “Cafe Excelsior Ikebukuro” (Ikebukuro is a neighborhood in Tokyo).

The initial version of the map was enough to satisfy my immediate needs – it allowed me to present choroplethr maps of Japanese census data, and was general enough to work with other countries as well.

But the map was always too slow for me to really enjoy doing exploratory data analysis with it. It was only after hearing from a few users about other issues with the map recently, plus recording screencasts of using the map for my course that really spurred me to revisit the issue. Hopefully this update makes life easier for some other R users out there.

Also, a big thanks to Nathaniel V. Kelso and everyone else who works on Natural Earth Data for creating this shapefile. I simply imported it into R and hooked it up to choroplethr.

2 comments
Giorgio says April 25, 2016

Hi Aril.
Very usefull your work!
Just a precisation:
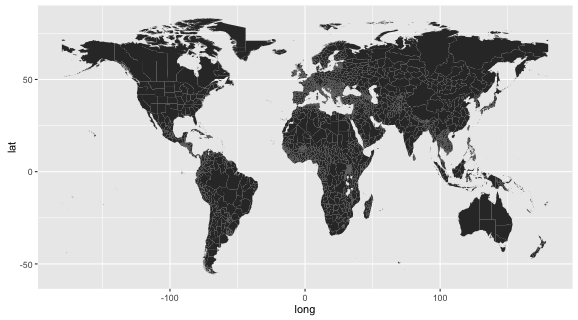
For Italy You used 2nd subnational division (110 provinces) And Not 1st division (20 regions) that are more use full.
Bye
Giorgio

Comments are closed