User Question: How to Add a State Border to a Zip Code Map?
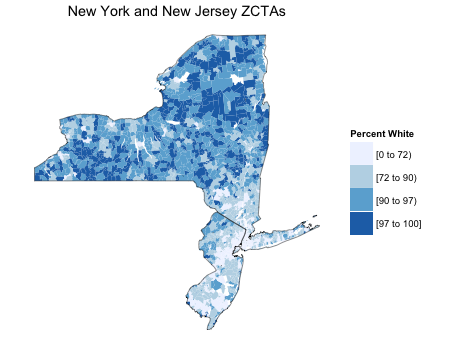
A user recently asked me how to add a state outline to a Zip Code map. Consider this map, which shows the percent white of each Zip Code Tabulated Area (ZCTA) in New York and New Jersey:
Clearly the ZCTAs in northern New York have the highest concentration of white residents. However, it would still be useful to see the border between New York and New Jersey.
Step 1: Build the Initial Map
This map has one complexity to it: it hides the actual ZCTA borders. This technique is very useful when viewing a large number of Zip codes and is described in detail here.
# Load the necessary packages
library(choroplethr)
library(ggplot2)
library(devtools)
install_github('arilamstein/[email protected]')
library(choroplethrZip)

# load the data
data(df_zip_demographics)
df_zip_demographics$value = df_zip_demographics$percent_white

# create the map
zip_map = ZipChoropleth$new(df_zip_demographics)
zip_map$ggplot_polygon = geom_polygon(aes(fill = value),
                                      color = NA)
zip_map$set_zoom_zip(state_zoom  = c("new york", "new jersey"),
                     county_zoom = NULL,
                     msa_zoom    = NULL,
                     zip_zoom    = NULL)
zip_map$title = "New York and New Jersey ZCTAs"
zip_map$legend = "Percent White"
zip_map$set_num_colors(4)
choro = zip_map$render()
choro
Step 2: Create the State Outlines
State outlines are rendered in the render_state_outline function in the USAChoropleth object. Here is how to store the outline:
data(df_pop_state)
outline = StateChoropleth$new(df_pop_state)
outline = outline$render_state_outline(c("new york", "new jersey"))
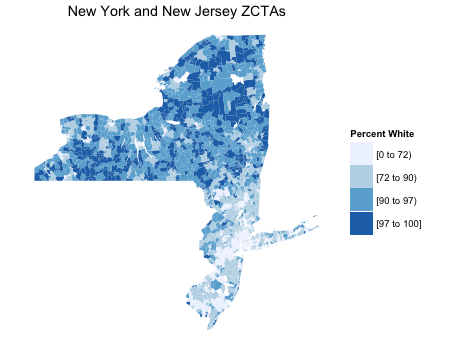
Step 3: Render the Combined Maps
The zip map and the outline are both ggplot objects. This means that they can be combined with the + sign:
choro_with_outline = choro + outline
choro_with_outline