Learn to Map Census Data in R

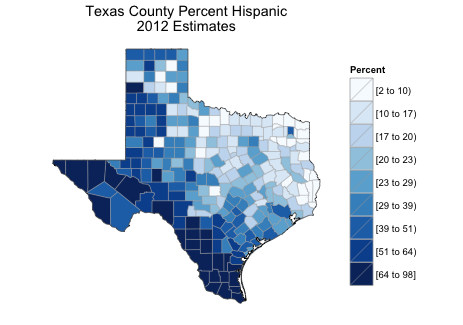
Today I am happy to announce a new free email course: Mapping Census Data in R. You can sign up here. The course is designed to provide similar information to what I covered in my tutorial Analyzing US Census Data with R. In short, it will teach you how to create choropleth maps of US demographics such as this1:

texas-county-percent-hispanic

The course has five email lessons, with three days between each lesson. The lessons are:

  1. Introduction. An introduction to the dataset we’ll use, a basic review of R, etc.
  2. States. Creating choropleth maps of US State demographics.
  3. Counties. Creating choropleth maps of US County demographics.
  4. ZIP Codes. Creating choropleth maps of US ZIP Code demographics.
  5. Conclusion. Wrapping up, pointers to more information.

The course is intended as an introduction. If it becomes popular I hope to follow it up with a more in depth course on a site such as Udemy.

1: The R code to create that chorpleth map is:

library(choroplethr)
library(choroplethrMaps)
library(mapproj)
library(ggplot2)
data(df_county_demographics)
df_county_demographics$value = df_county_demographics$percent_hispanic
county_choropleth(df_county_demographics,
                  state_zoom = "texas",
                  title      = "Texas County Percent Hispanic\n2012 Estimates",
                  num_colors = 9) + coord_map()
8 comments
friend says June 26, 2015

Do students start whenever they want and just get e-mails as the timeline above suggests? Any prerequisites? Do I have to install R myself or is that covered?

    Ari Lamstein says June 26, 2015

    Yes. As soon as you signup you get lesson 1. You have to install R yourself, but lesson 1 covers that.

Anonymous Coward says June 29, 2015

I believe your example code is missing library(ggplot2).

    Ari Lamstein says June 30, 2015

    You are correct and I have updated the post. Thank you.

liamboltonukLiam says July 9, 2015

Great tutorial, thanks for sharing. How can I apply this to a county or local authority in the UK, for instance?

    Ari Lamstein says July 9, 2015

    I created a package called choroplethrAdmin1 which shows administrative level 1 maps of every country in the world. (Administrative Level 1 = states/provinces of countries). Here is some documentation of that package, with an examples of the prefectures of Japan.

    Additionally, choroplethr is really designed to work with any shapefile. I have two free resources for getting started with that.

    1. Mapmaking for R Programmers
    2. Object Oriented Choropleths

    If you have further questions I recommend posting on the choroplethr google group.

Jan Vandermeer says October 8, 2015

I wanted to start working through the tutorial and decided to make sure the package chloroplethrMaps was installed and up to date, so ran install.packages(chloroplethrMaps) which gave the messages that the package was not available for R 3.2.2 (package ‘chloroplethrMaps’ is not available (for R version 3.2.2))

    Ari Lamstein says October 8, 2015

    It looks like you misspelled the package name:

    install.packages(chloroplethrMaps) -> install.packages(“choroplethrMaps”)

Comments are closed